

How the prehistoric coastline influences US elections
From geological times and throughout part of US history, we explore how it still influences elections in the South today.

There is a recurring image that has been circulating on social media. From what I have found, it was posted about five years ago on Reddit, although the idea may predate this.

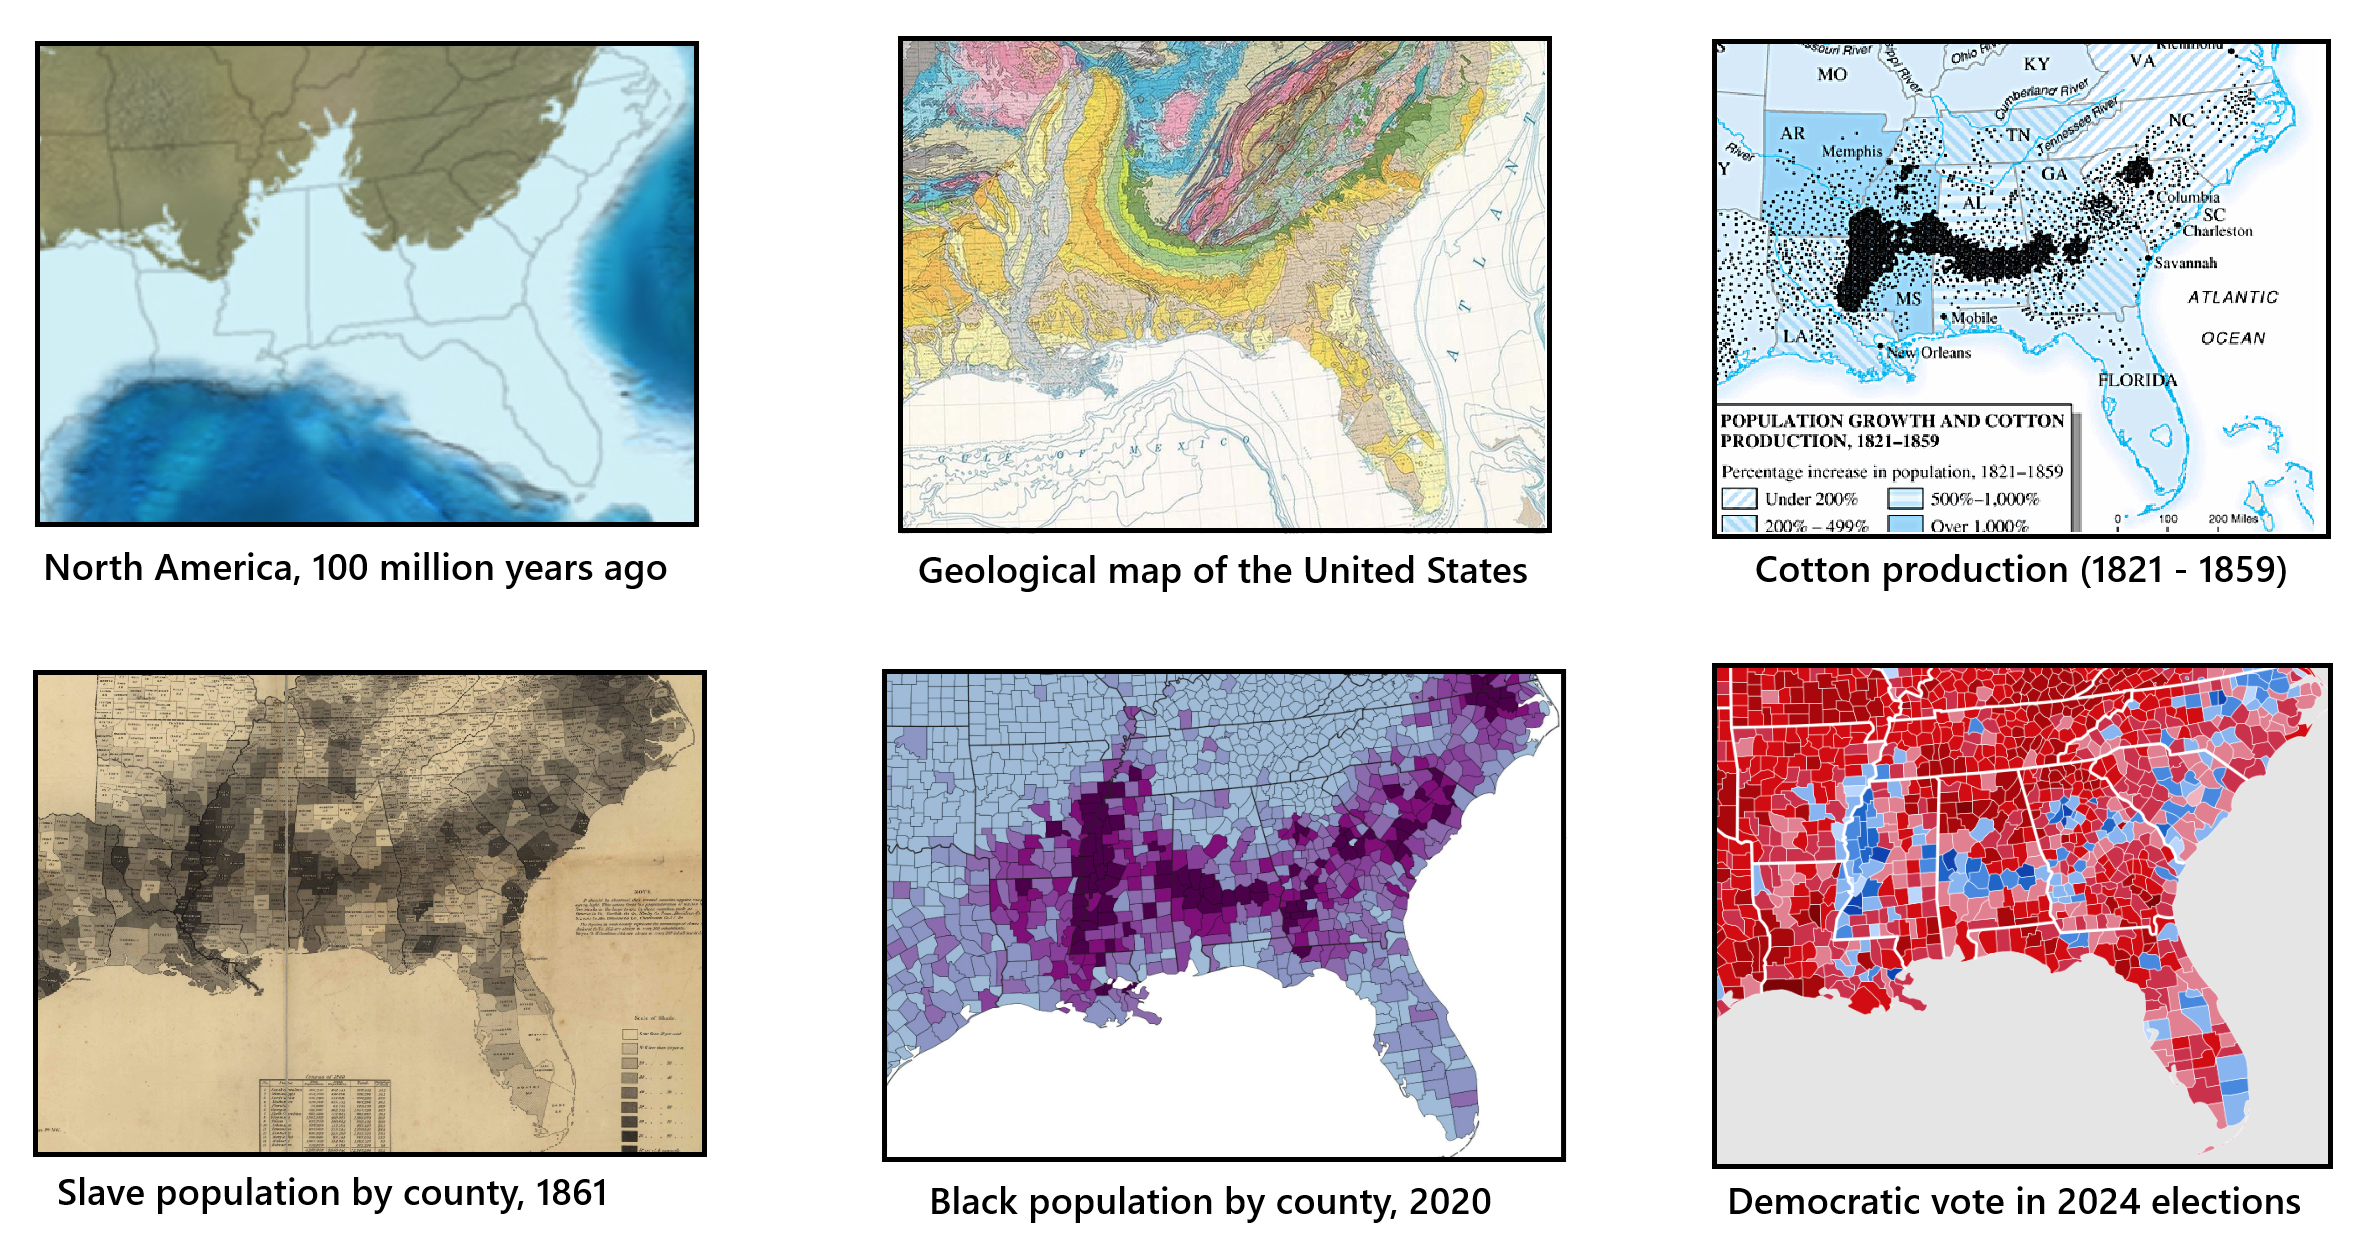
The illustration is simple. It shows six maps of Alabama, in the south-east of the United States, revealing a striking correlation between sediments from the Cretaceous period, the slave population in the 19th century, the black population in the 20th century, and the results of the 2020 general election.
While the correlation is interesting in itself, today I am going to talk about how all these facts are linked and that this is not just coincidence. There is a causality that can be explored and explained. And well, this is true for the entire Cotton Belt, not just Alabama.
Distant prehistoric times
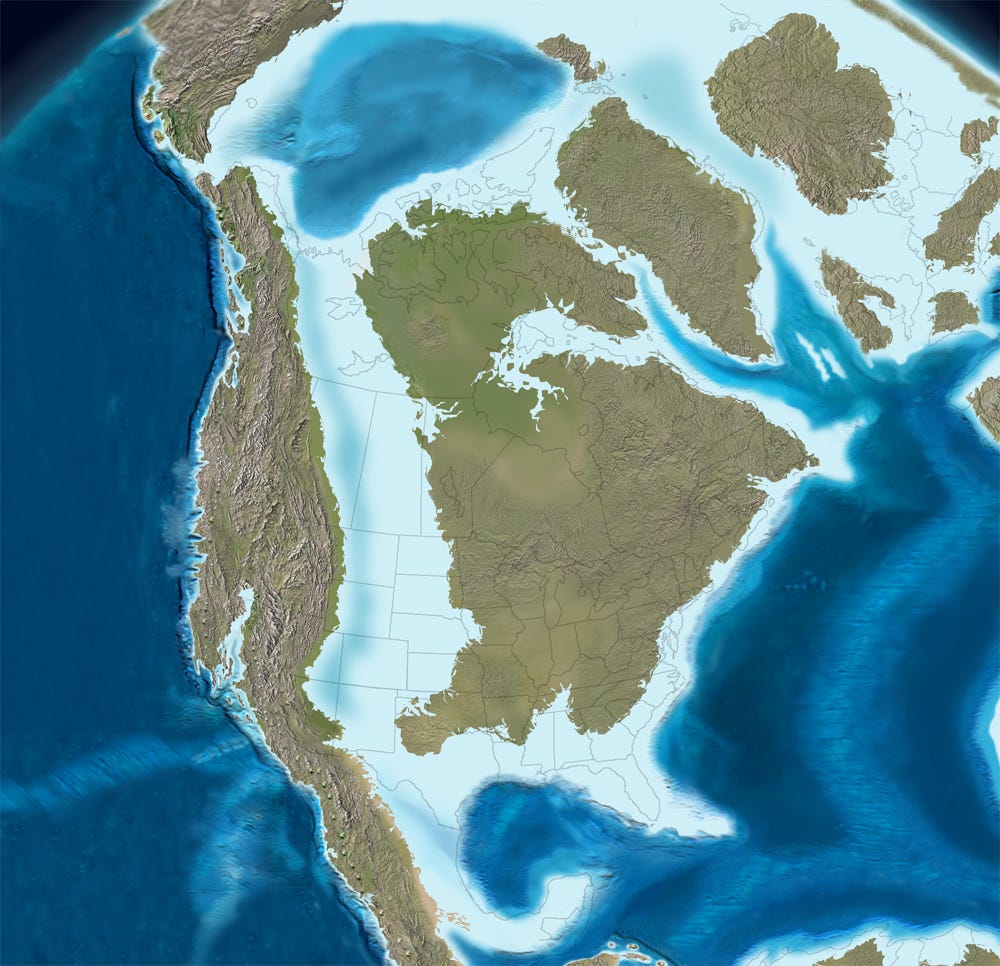
Geological scales are immense, and I could dedicate paragraphs and paragraphs to that alone, but we would surely all end up bored. I just want to point out that the Cretaceous period spans 145 million to 66 million years before our era, the moment when the last dinosaurs became extinct. Right in the middle of that period, around 100 million years before our era, the distribution of continents was still quite different from today, but North America was already beginning to take the shape it has today.
The global temperature was higher, so the oceans were several metres above the current sea level. Because of this, much of the south-east of what is now the United States was submerged. These seas were only a few metres deep, which facilitated the gradual1 formation of an extensive layer in which small particles. These originated from the erosion of the Appalachian Mountains in the north, mixed with plankton remains and the skeletons of small marine animals.
About 34 million years ago, the Late Cenozoic Ice Age began, which is the name given to the period in which we are currently immersed. The global temperature began to drop, which contributed to the formation of large glaciers in Antarctica. Initially, they were located only in the mountainous areas of the continent, but thanks to the cold, they spread to form a huge ice cap covering the continent, reaching its current size 14 million years ago. All this ice was fed by water from the oceans, causing the seas to recede and many of the current low-lying plains to emerge. This is how a vast, porous, dark-coloured, nutrient-rich soil was left exposed, covering much of what are now the states of Mississippi, Alabama, Georgia, South Carolina and North Carolina.
European colonialism and slavery
In 1492, Christopher Columbus put America on the map, at least in the eyes of Europeans, beginning a period of several centuries in which various European powers colonised the new continent. The exploitation of the new territory soon demanded cheap labour, which, according to the standards of the time, led to an increase in the slave trade from Africa to different parts of America.
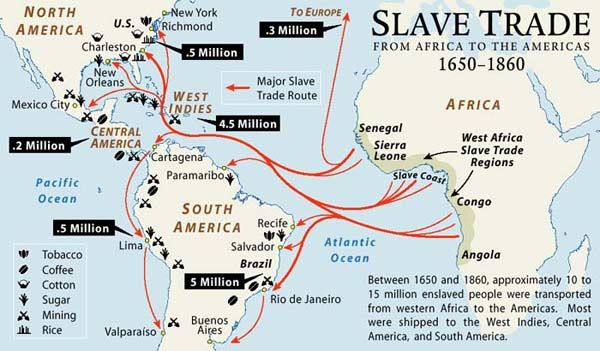
The main powers that promoted this practice were the British Empire, France and Portugal2, which resulted in a large African population becoming part of Brazil, the Caribbean, and the south-east of North America. The map above is a good approximation to understand the main flows, as well as the main work of the new arrivals: tobacco, coffee, cotton, and sugar plantations.
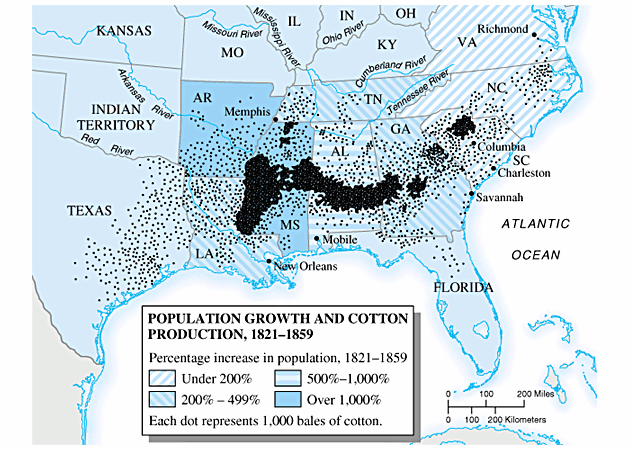
In the black, fertile soils of the southern United States, cotton cultivation predominated. The land was exploited through large plantations, where a few landowners exploited thousands of African slaves to obtain the greatest possible profit. The impact of the soil is curious, as cotton production was orders of magnitude greater than all attempts in slightly more remote areas, as shown by this map of cotton production in the region between 1821 and 1859.
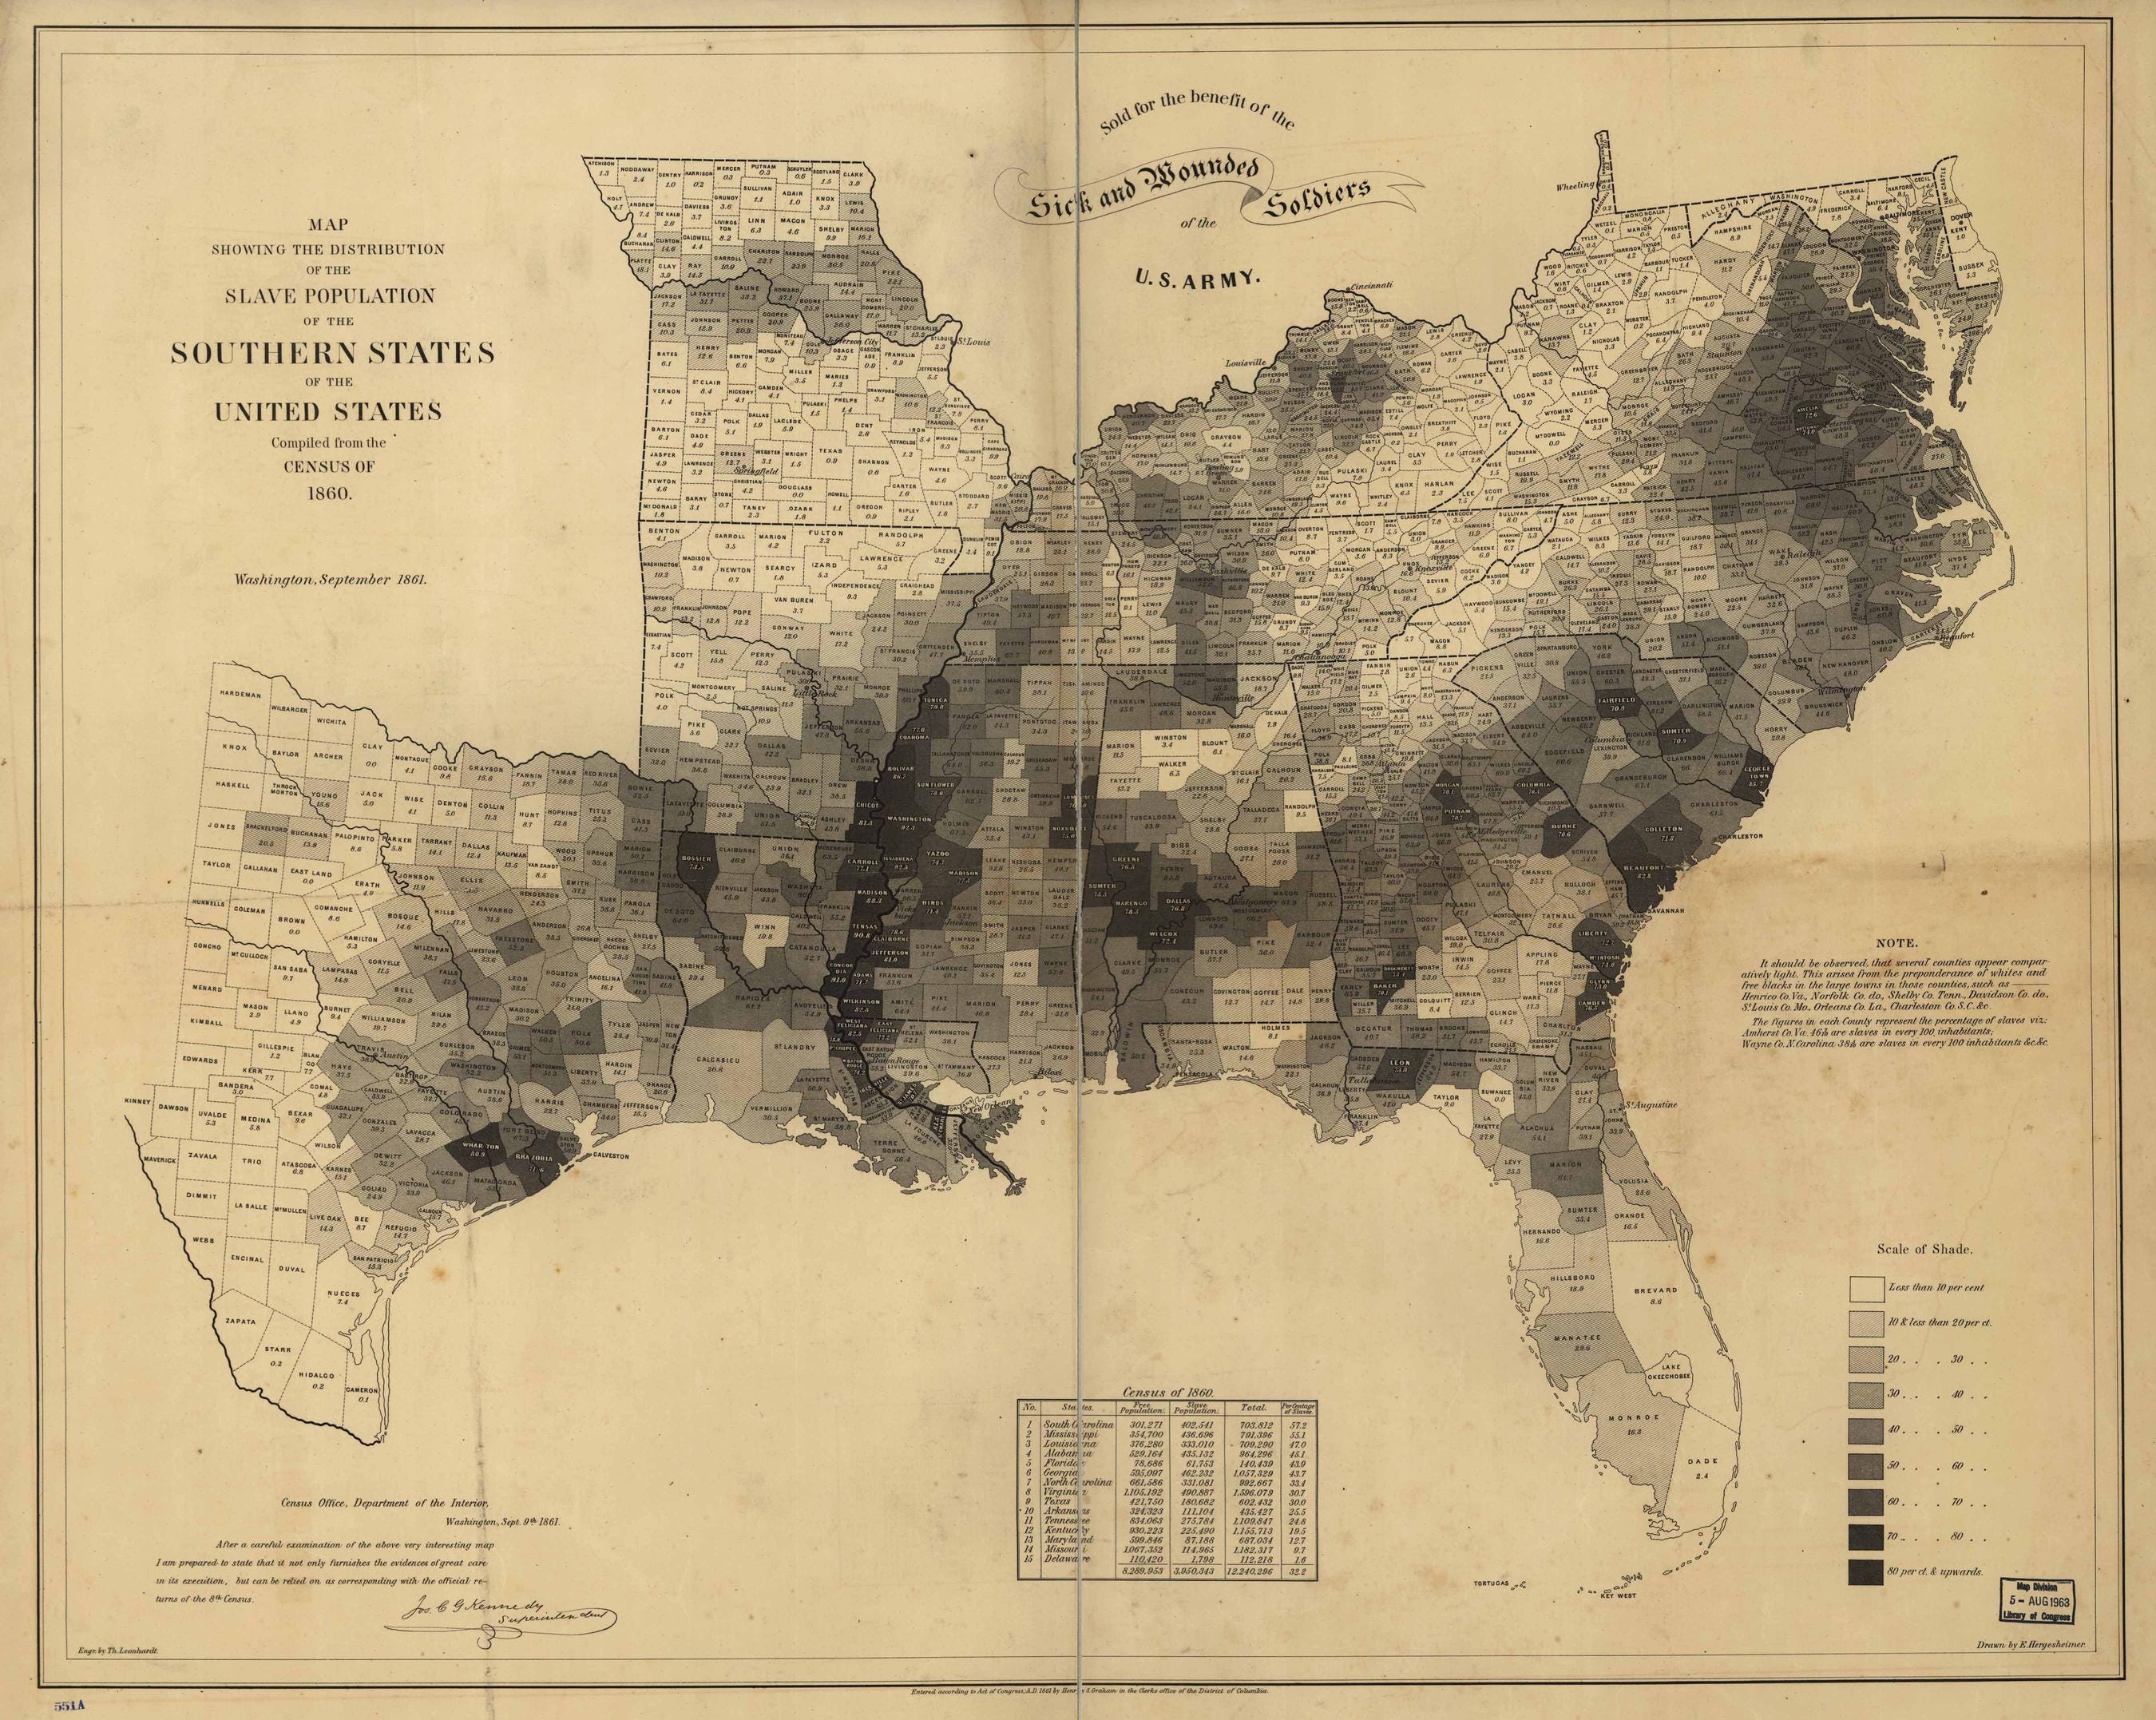
This boom also led to an exponential increase in the black population in the counties where these plantations were located. In 1860, a year before the start of the Civil War, many of these counties had a slave population that accounted for more than 70% of the total population. Such was the case in Morgan, Georgia (70.1%); Madison, Louisiana (88.3%); Wilcox, Alabama (72.4%); Wilkinson, Mississippi (82.5%); and Fairfield, South Carolina (70%). What's more, in the map below you can see that recognisable curve, but this time plotted with the counties with the highest percentage of slaves.
The black belt and the Democratic vote
At the end of the Civil War, in 1865, a new constitution was passed that abolished slavery once and for all throughout the United States. This led to some migration within the country, as some families wanted to build a future far from the lands that had kept them enslaved. However, despite what is often believed, the majority of the black population did not leave the same area where their ancestors had been enslaved. In 1910, 90% of the black population in the United States was concentrated in the same states. Not only that, but in 2020, the black population was still in the majority in the same counties as 150 years earlier.

Using the same counties I mentioned above as a reference, this is the percentage of the black population in 2020 (compared to 1861):
Calhoun, Georgia: 70.1% in 1861, 64.26% in 2020.
Madison, Louisiana: 88.3% in 1861, 62.13% in 2020.
Wilcox, Alabama: 72.4% in 1861, 71.68% in 2020.
Wilkinson, Mississippi: 82.5% in 1861, 67.39% in 2020.
Fairfield, South Carolina: 70% in 1861, 53.71% in 2020.
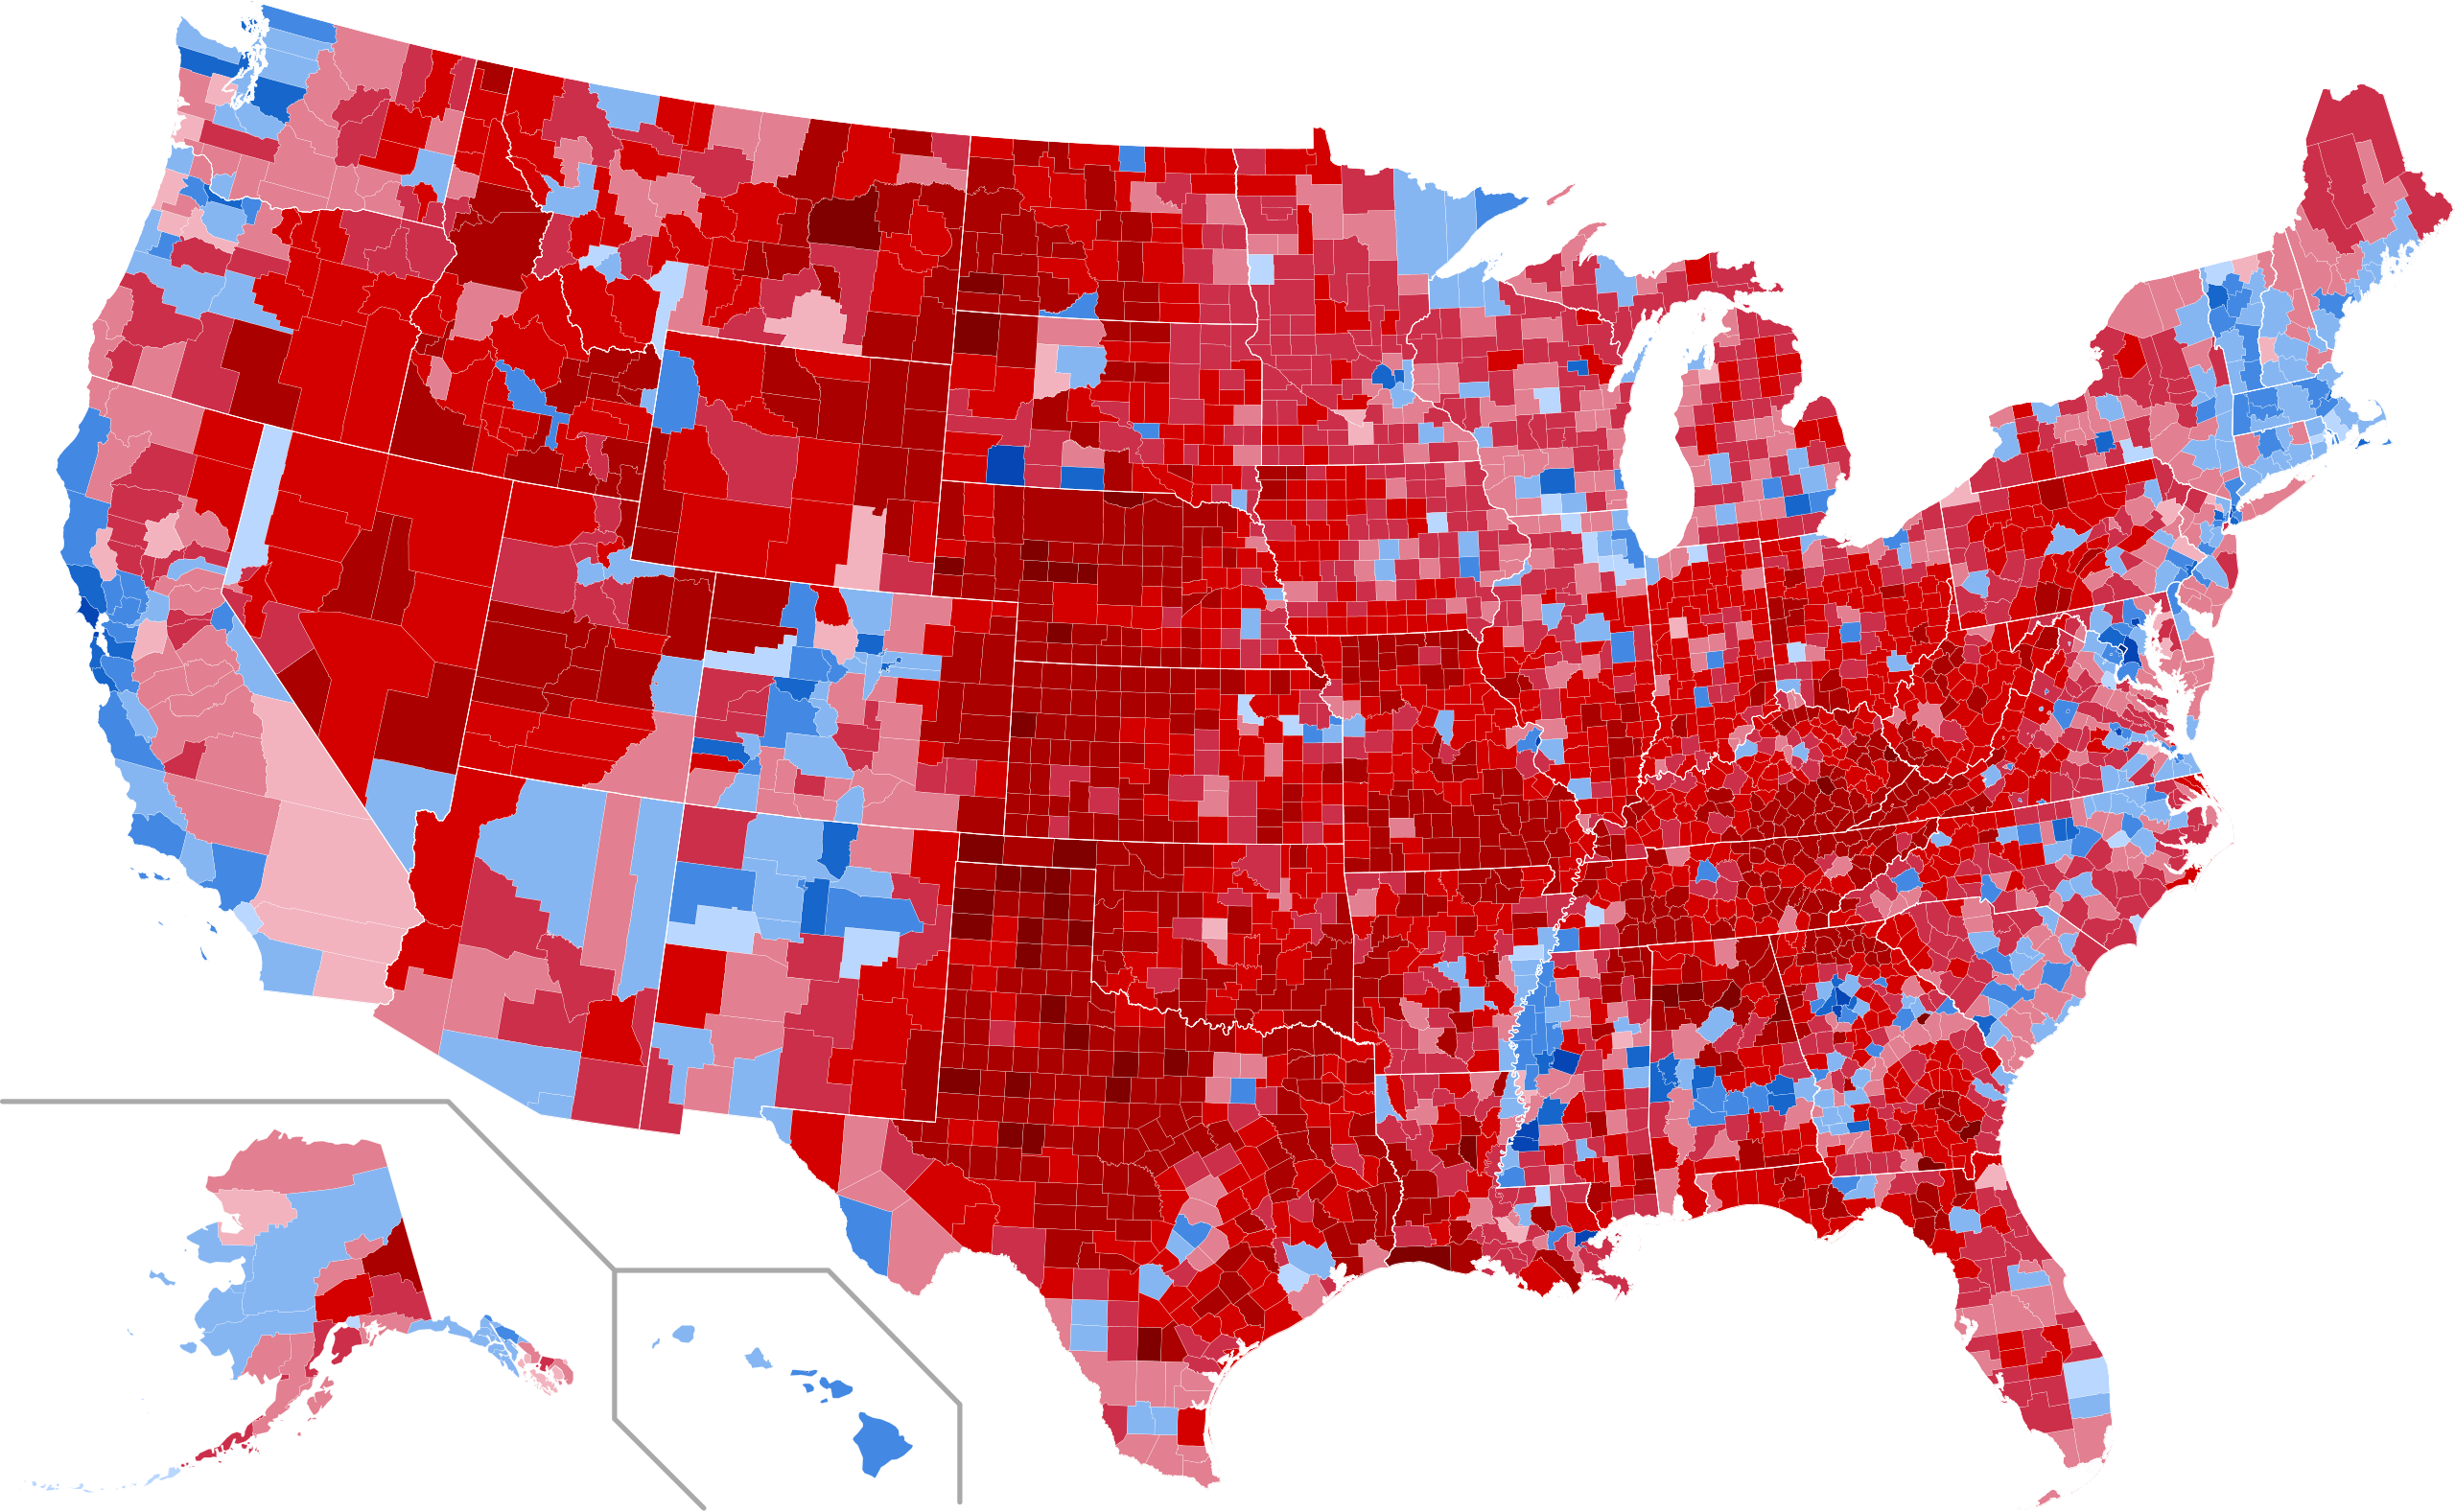
This peculiar ethnic distribution in some counties in the southern states has had a significant impact on presidential elections in recent decades. Since 1968, no Republican candidate in the US elections has won more than 13% of the black vote. The reasons for this are not merely historical, as slavery was ended mainly thanks to the Republican Party, and it would certainly be too lengthy to explain in this newsletter. But if you are interested in finding out more, here is a book that explores this topic.
In any case, the fact that the African American population has rejected the Republican Party outright for the last 50 years has resulted in an interesting pattern in what is known as the Black Belt3.
If we now take the maps I have brought you today, we can see that the pattern shown in the first image is not unique to Alabama, but to the entire Black Belt. The same outline as the Cretaceous coastline represents the sedimentary areas of that period, the cotton-growing areas, the black population and the Democratic vote today.
In geological terms, of course.
But not only. All European colonial powers play a role.
I would rather not make this too long, so I'll just mention it here. There is no consensus on the true origin of the term Black Belt. At the beginning of the 20th century, there were already references to the fact that it had nothing to do with the black population, but rather with the colour of the fertile soil used for cotton plantations.
Brilliant.
Next time I choose a belt to wear, I will think thrice about the color I choose.
And oh my gosh, what new meaning can be gleaned from the advice about appropriate choices in menswear: No Brown In Town!
a curious point, the black soils are also present on the other side of the Appalachians, see Cambridgeshire, UK